Menu
Close

BY KARTIK SHINDE – EQUITIES ANALYSIS
Next Gen Voice
The KOSPI, which is essentially South Korea’s S&P 500, is down about 28% in just one month. The reason for this is a scenario called a margin call doom loop.
Almost everyone in South Korea seemed to be quitting their jobs and getting into the stock market, which was largely driven by just two stocks: SK Hynix and Samsung, making up about 56% of the entire index. Watching the market boom, retail investors quit their jobs and started trading on margin. The catch was that they were not just buying ordinary stocks — they were buying 2x and 3x leveraged ETFs, which promise two to three times the return of the underlying stock’s move.
However, when Micron’s earnings and growing fears surrounding AI valuations and capital expenditure (CapEx) spending finally reached a pinnacle, everything collapsed. Retail investors were hit with margin calls, forcing them to either deposit more cash into their accounts or have their positions liquidated. This triggered a margin call doom loop.
If investors failed to deposit more money, brokers sold their positions, driving stock prices even lower. Those falling prices then triggered even more margin calls, leading to further forced selling — creating an endless cycle.
But the real question is: How does this affect U.S. markets?
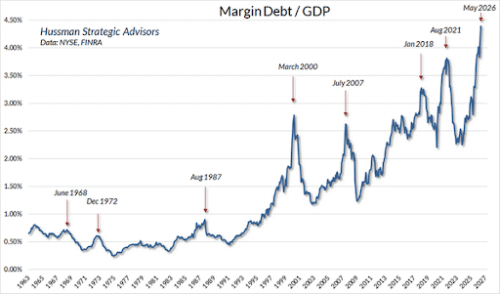
The U.S. stock market is showing signs that are not much different from South Korea’s. U.S. margin debt relative to the market has reached a historical peak of about 4.71%, suggesting that more investors are trading leveraged ETFs using margin accounts. On the other hand, the projected return on AI capital expenditures from companies like Microsoft, Google, Amazon, and Meta is around 10 cents on the dollar, which is extremely poor.
MSFT trailing 12-month price — 52-wk high $555.45 vs. current $388.84
FIGURE 01 — MARGIN DEBT / GDP, 1963–2026
Every prior peak (1968, 1972, 1987, 2000, 2007, 2018, 2021) preceded a market drawdown. May 2026 marks a new high. Source: Hussman Strategic Advisors; NYSE and FINRA.
Another interesting phenomenon is that this year, funds raised through IPOs and their post-IPO market capitalizations have reached roughly twice the levels seen during the dot-com bubble. This suggests that insider investors may believe current valuations represent one of the best opportunities to take profits and exit.
Now, the factor that could make or break this bubble — and the number that investors are watching most closely — is CapEx. If any of the hyperscalers announce that they’re reducing capital expenditures, the bubble could burst because it would signal a collapse of this highly valued AI earnings cycle, where expectations have outpaced actual returns.
On the other hand, the AI boom could continue if the hyperscalers can convincingly demonstrate meaningful returns from the massive amounts they’re spending on AI. However, the latter seems less likely.
For now, the prudent approach is to closely monitor this earnings season, maintain a relatively high cash position, and observe how the market reacts.
| MARGIN DEBT / GDP — HISTORIC PEAK 4.71% | AI CAPEX RETURN — PER DOLLAR SPENT ~$0.10 |
CREDITS FINRA · Andrei Jikh · Hussman Strategic Advisors
Disclaimer – Not financial advice. This article is for informational and educational purposes only. Views expressed are the author’s own. Always consult a licensed financial advisor before making investment decisions.